The Middle-Man 2™ System (aka MM2™) is a computer system designed to act as the event supervisor between the line controller (PLC) and the image processing computers. The system can handle the data flow of up to three image processing units working simultaneously. The MM2™ will provide instructions to the image processor, obtain inspection results and then store the acquire images (both grayscale and z-height images) for review or reprocessing. The information is presented to the operator in a format that is easily understandable. The Human Machine Interface (HMI) is displayed on a large flat panel display mounted on the front panel of the Middle-Man electrical enclosure. This interface provides current and past inspection results for each of the image processors. Defect location information is displayed on grayscale images along with defect statistics.
The Middle-Man system architecture is designed around three primary components, the Python Kernel, the SQL Database, and HMI Operator Interface. Each of these components operate as independent programs but communicate with each other to provide the system functionality. The primary function of the Python Kernel is to communicate to the line PLC and to each of the image processors. All communication is performed using Ethernet. The Middle-Man PC acts as a “Black Box”, it only acts on instructions from the PLC. The PLC provides a request and the MM2™ acts upon it by sending the request to the appropriate image processor. The MM2™ waits for the completion of the requested task and send the inspection result back to the PLC. Each image processor has an FTP server function that sends the acquired images back to the Middle-Man for storage.
The SQL is designed as the information storage for the inspection files (deterministic and image). The SQL automatically compile the result data provided by the FTP accumulated files and organize them by PUN, Date / Time of inspection, and Defect Statistics (if available). The SQL database can be filtered by parameters selected by the user.

PVSIS™ HMI Menu Structure
The PVSIS™ system is composed of several components. The components are the image processing system(s), the Middle-Man™ computer, the flat panel display, Keyboard, mouse, Ethernet connections (6 minimum) and several pieces of software that connect the various components to Middle-Man™ computer. The Middle-Man™ computer currently uses the Window® 10 Pro operating system from Microsoft Corporation®, this will be replaced with Windows® 11 Pro before September 2025. The system is protected to prevent unauthorized users from accessing the Windows utilities and file system. The system will automatically start the required programs when powered on and load the PVSIS™ HMI interface program. The number of tabs that appear on the HMI depends on the number of scanning systems implemented. Normal implementation is one sensor per robot (or scanning system). The Tabs may be labeled as Robot # or Face # depending on the number of scans required. The PVSIS™ system can perform multiple scans per face. If the component under inspection has a large surface area multiple scans may be required to cover the surface with overlap regions between each scan.
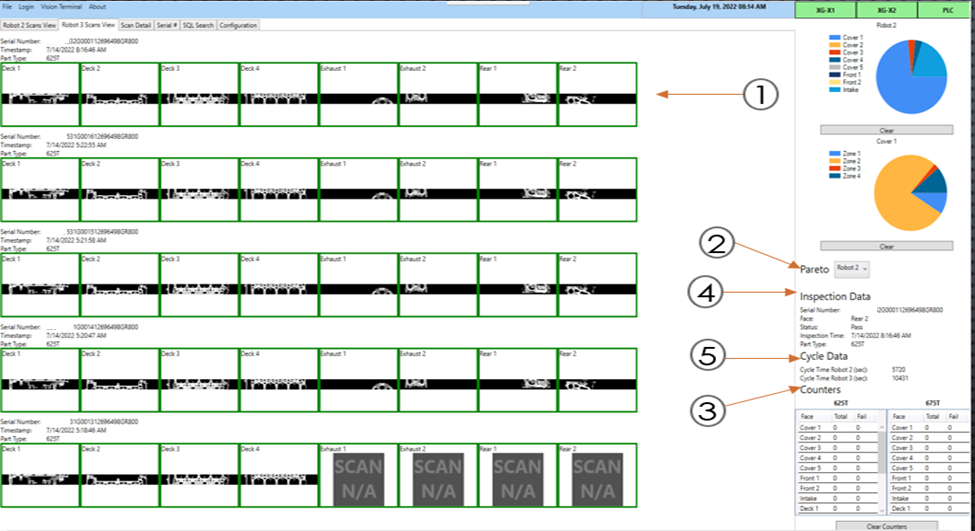
The image below is the primary scan of the HMI for a typical PVSIS™ setup that scans multiple surfaces on a component. This example has eight scan to cover three different faces of the component. There is normally a separate tab on the HMI for each sensor implemented. Some applications will combine multiple sensors and put all scans related to a single face on one tab.

The Robot Scan tab has five different displays for data:
- Visual – Images obtained from individual scans during the process. The images will either display with a green outline around the image indicating a good part which will be passed on. If the part is bad, it will fail and be rejected, this will result in a red outline around the image as well as the points that the laser scans indicated as the defect areas in the image. This example all scans indicate that no defective condition has been isolated.
- Pareto Chart – Populated from the inspection data acquired from the counters. Gives more of a visual representation for the number of defects for different face scans.
- Counters – Gives the total number of scans for each of the face surfaces for each part type. This also displays the total number of pass and fail inspections respectively.
- Inspection data – Displays the serial number, face name, pass/fail data, inspection time and part type of current scan in progress.
- Cycle Data – This is indicating the tact time (complete inspection cycle of one part to the next part. The time will change based on the production rate of the line.
Cycle Data – Each row in the HMI represents one scan set. The row is indexed (pushed down) on the HMI every time a new component is scanned. The last scan is positioned on top, oldest scan (earlier time) is positioned on the bottom.
Comments are closed